10 most interesting examples of Customer Journey Maps
9 September 2015In the previous text I described how to create a Customer Journey Map in few easy steps. Today I’d like to present some examples of inspiring maps which differ in their form, level of detail and approach to the issue.
1.
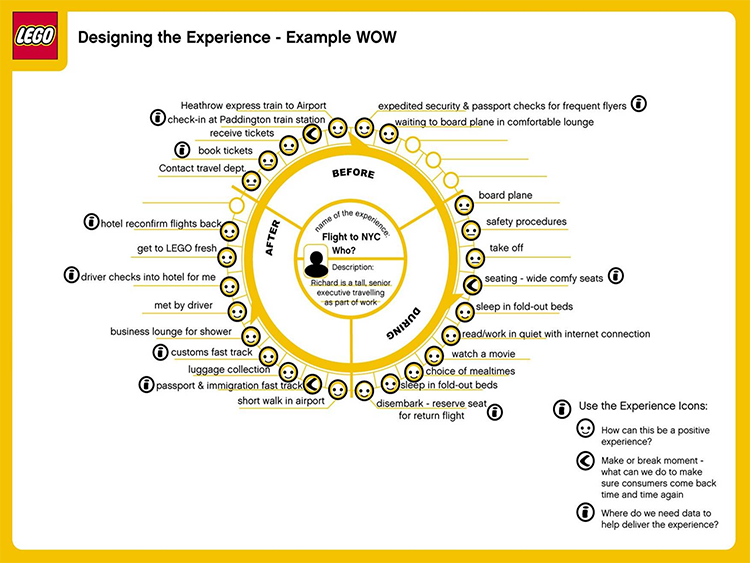
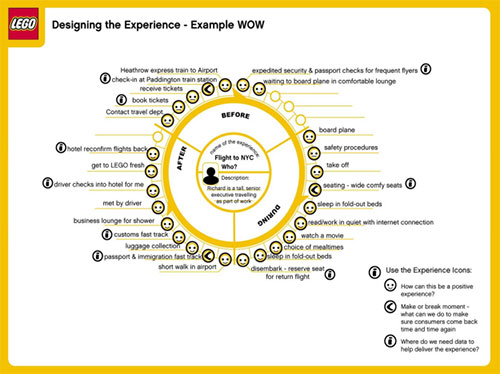
Let me start with a Customer Journey Map created by LEGO. Presented tool is called the “experience wheel”. It is constructed in an interesting and simplified way and shows the analysis of a flight to the New York City. The central part of the wheel includes persona’s characteristics. The next circle is divided into three levels of experience and achieving the goal of travelling. Outside the circle we’ll find descriptions of every step a person will take for this journey. Every step was marked with an emoticon mirroring positive, neutral or negative experience. This form of a map is really simple and easy to make – even at a meeting during discussion on ideas or issues. It’s a great way of taking a quick look at our product or service ‘through the eyes of the customer’.
source:
http://www.paulolyslager.com/wp-content/uploads/2015/04/lego.jpg?997da0
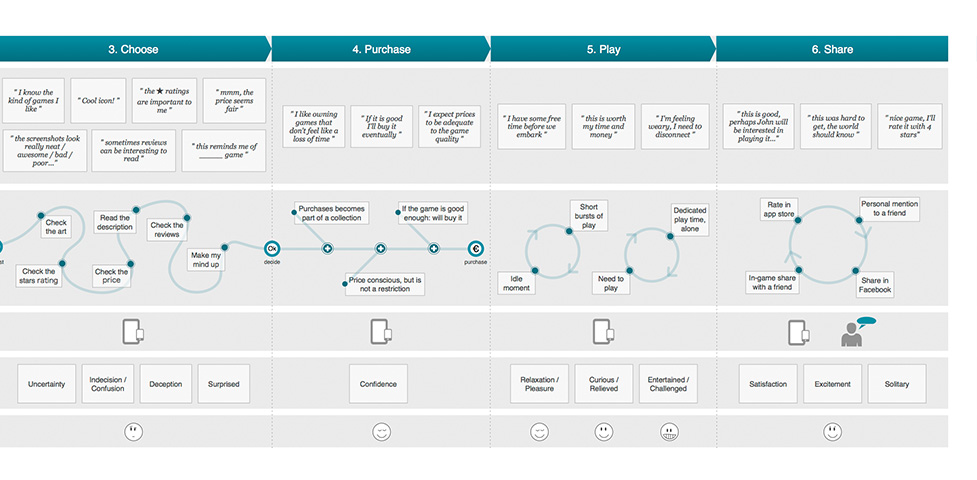
2.
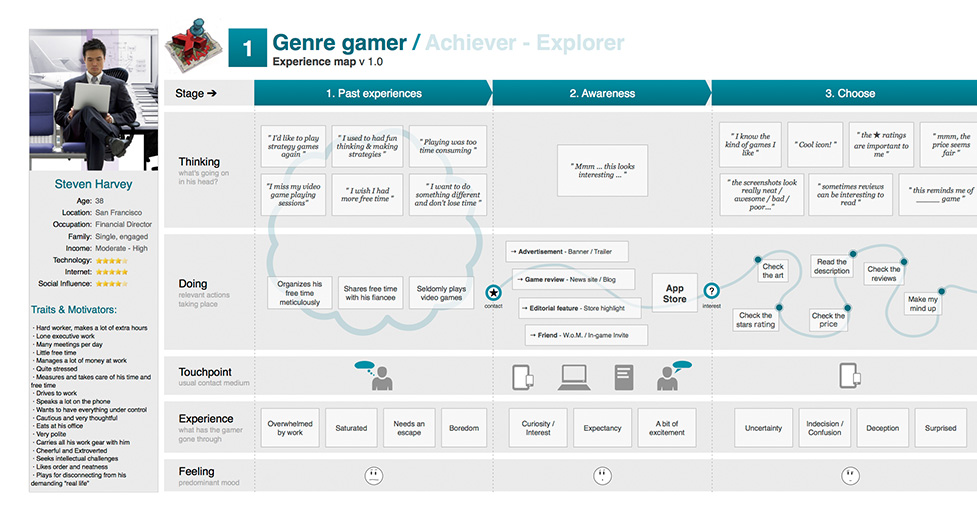
The second Customer Journey Map that I’d like to discuss is a very simple, but at the same time full of data, analysis of a potential gamer who is a hard-working Financial Director. This map also uses a description of a persona but we’ll find more details here, both personal – aims, habits, motivations – and a profile of gaming experience. This unusual behavioural approach shows how a previous gaming experience has shaped the awareness and the way of perceiving games by a given user and how it has influenced his decisions. Such analysis of thinking, doing and feeling enables identifying the root causes of negative and positive experiences from using our products. This is a very good starting point for the detailed analysis to answer a question – which user experience we’d like to change and how?
source:
https://www.behance.net/gallery/16468925/Mobile-Game-Journey-map-Persona-definition
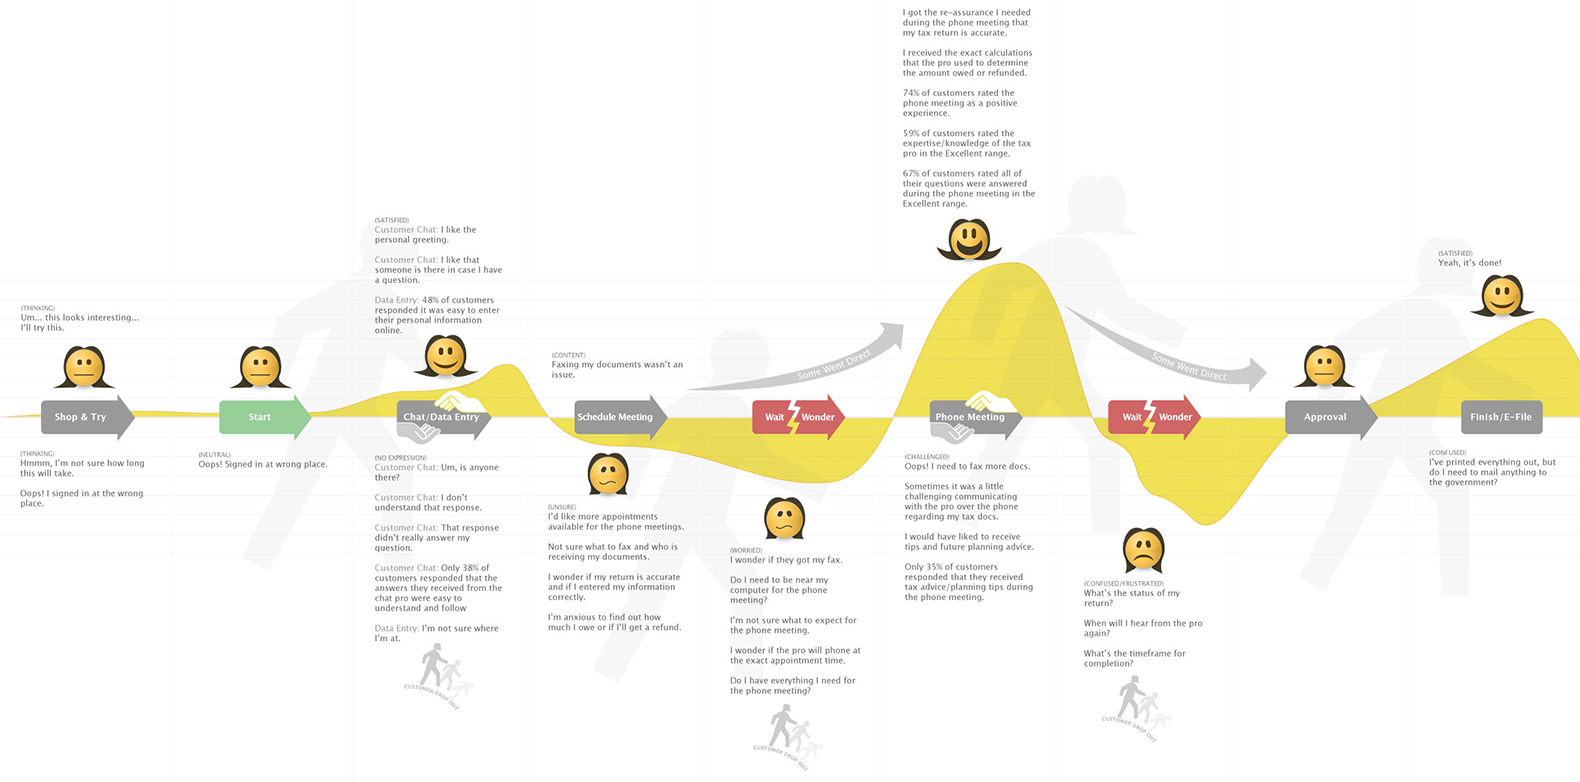
3.
The next tool I’d like to discuss is a Customer Experience Map which is similar to the Customer Journey Map. The difference between these two is that in CEM we analyse a general experience of the customer focusing on the customer service process while in CJM we choose one typical customer and describe his or her experience from the perspective of a specified situation and context. With the use of the map presented below we can easily identify what opportunities and threats to the positive customer experience we can find in our customer service process – e.g. return of a product purchased online.
source:
http://cxday.de/wp-content/uploads/2014/05/KerryBodine.com-Intuit-journey-map.png
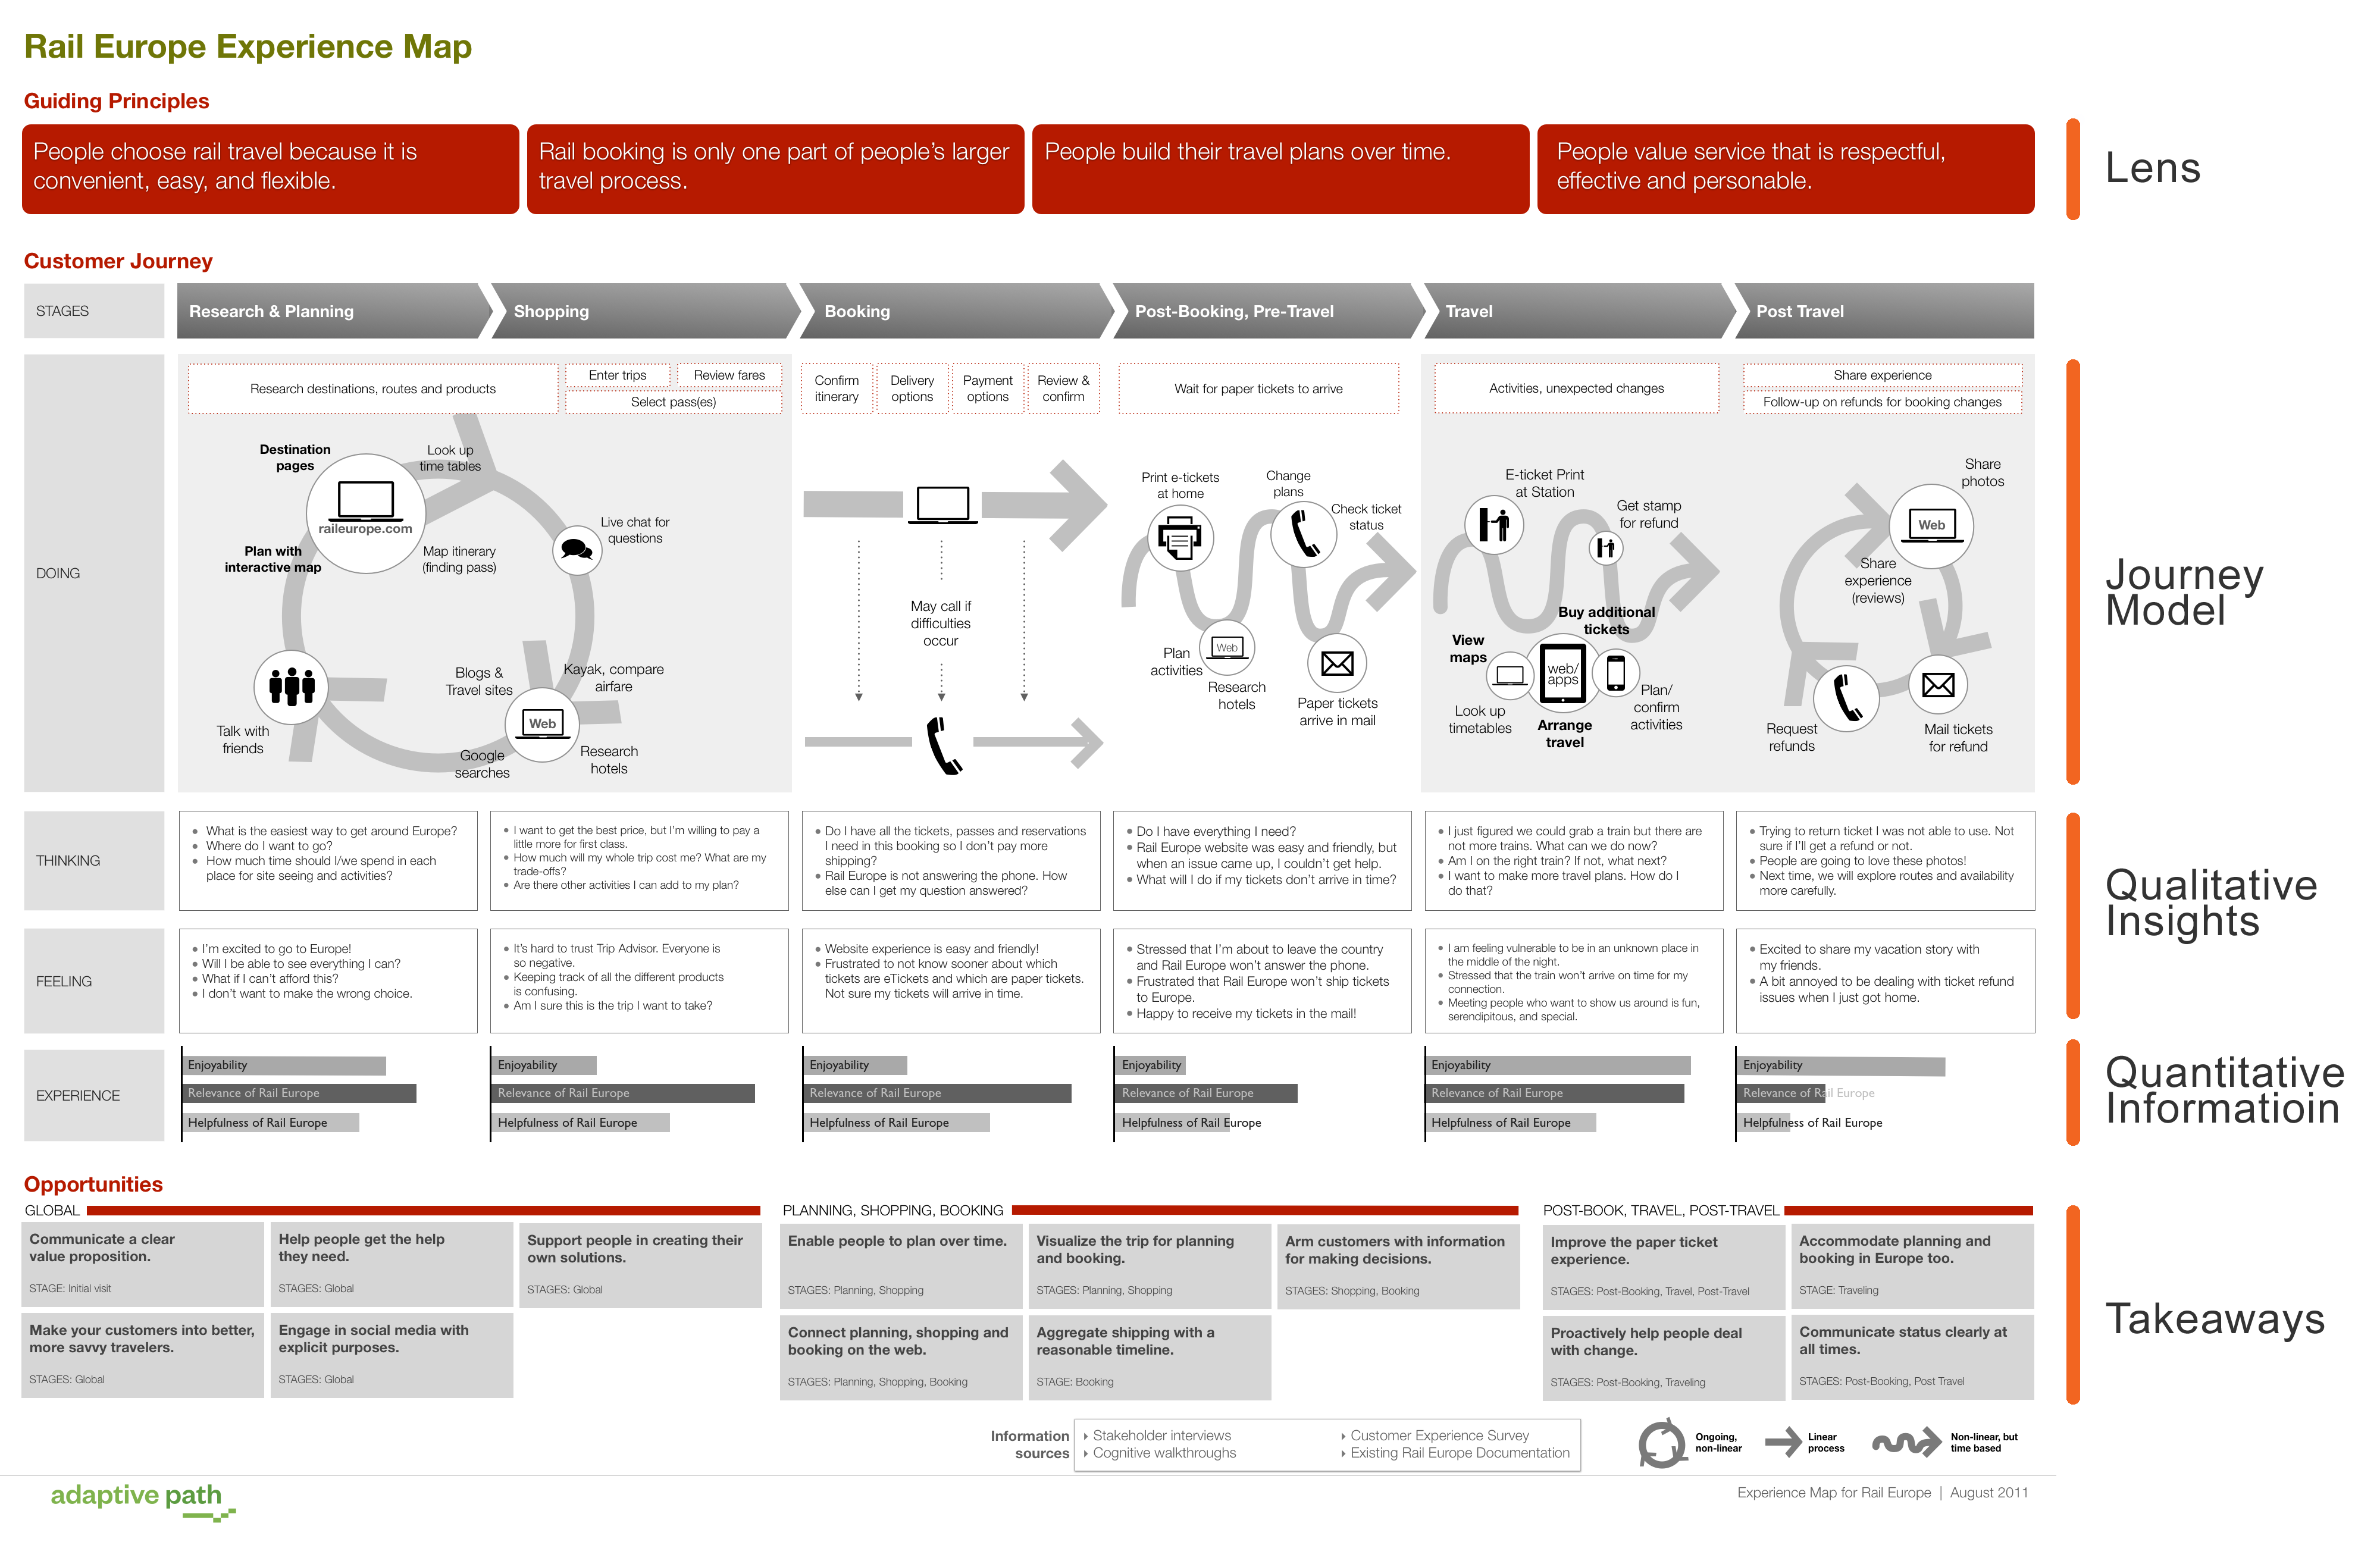
4.
The next map is also closer to the Customer Experience Map, mostly because of a general analysis of customer experience, rather than choosing a perspective of a typical representative of a customer group. What differentiates this map from others is specifying opportunities and possible improvement areas which lead to making customer experience better. This a key added value of creating customer experience maps – noticing areas which can sometimes be very easily improved to significantly increase the level of customer satisfaction.
source:
http://uxmastery.com/ux-marks-the-spot-mapping-the-user-experience/
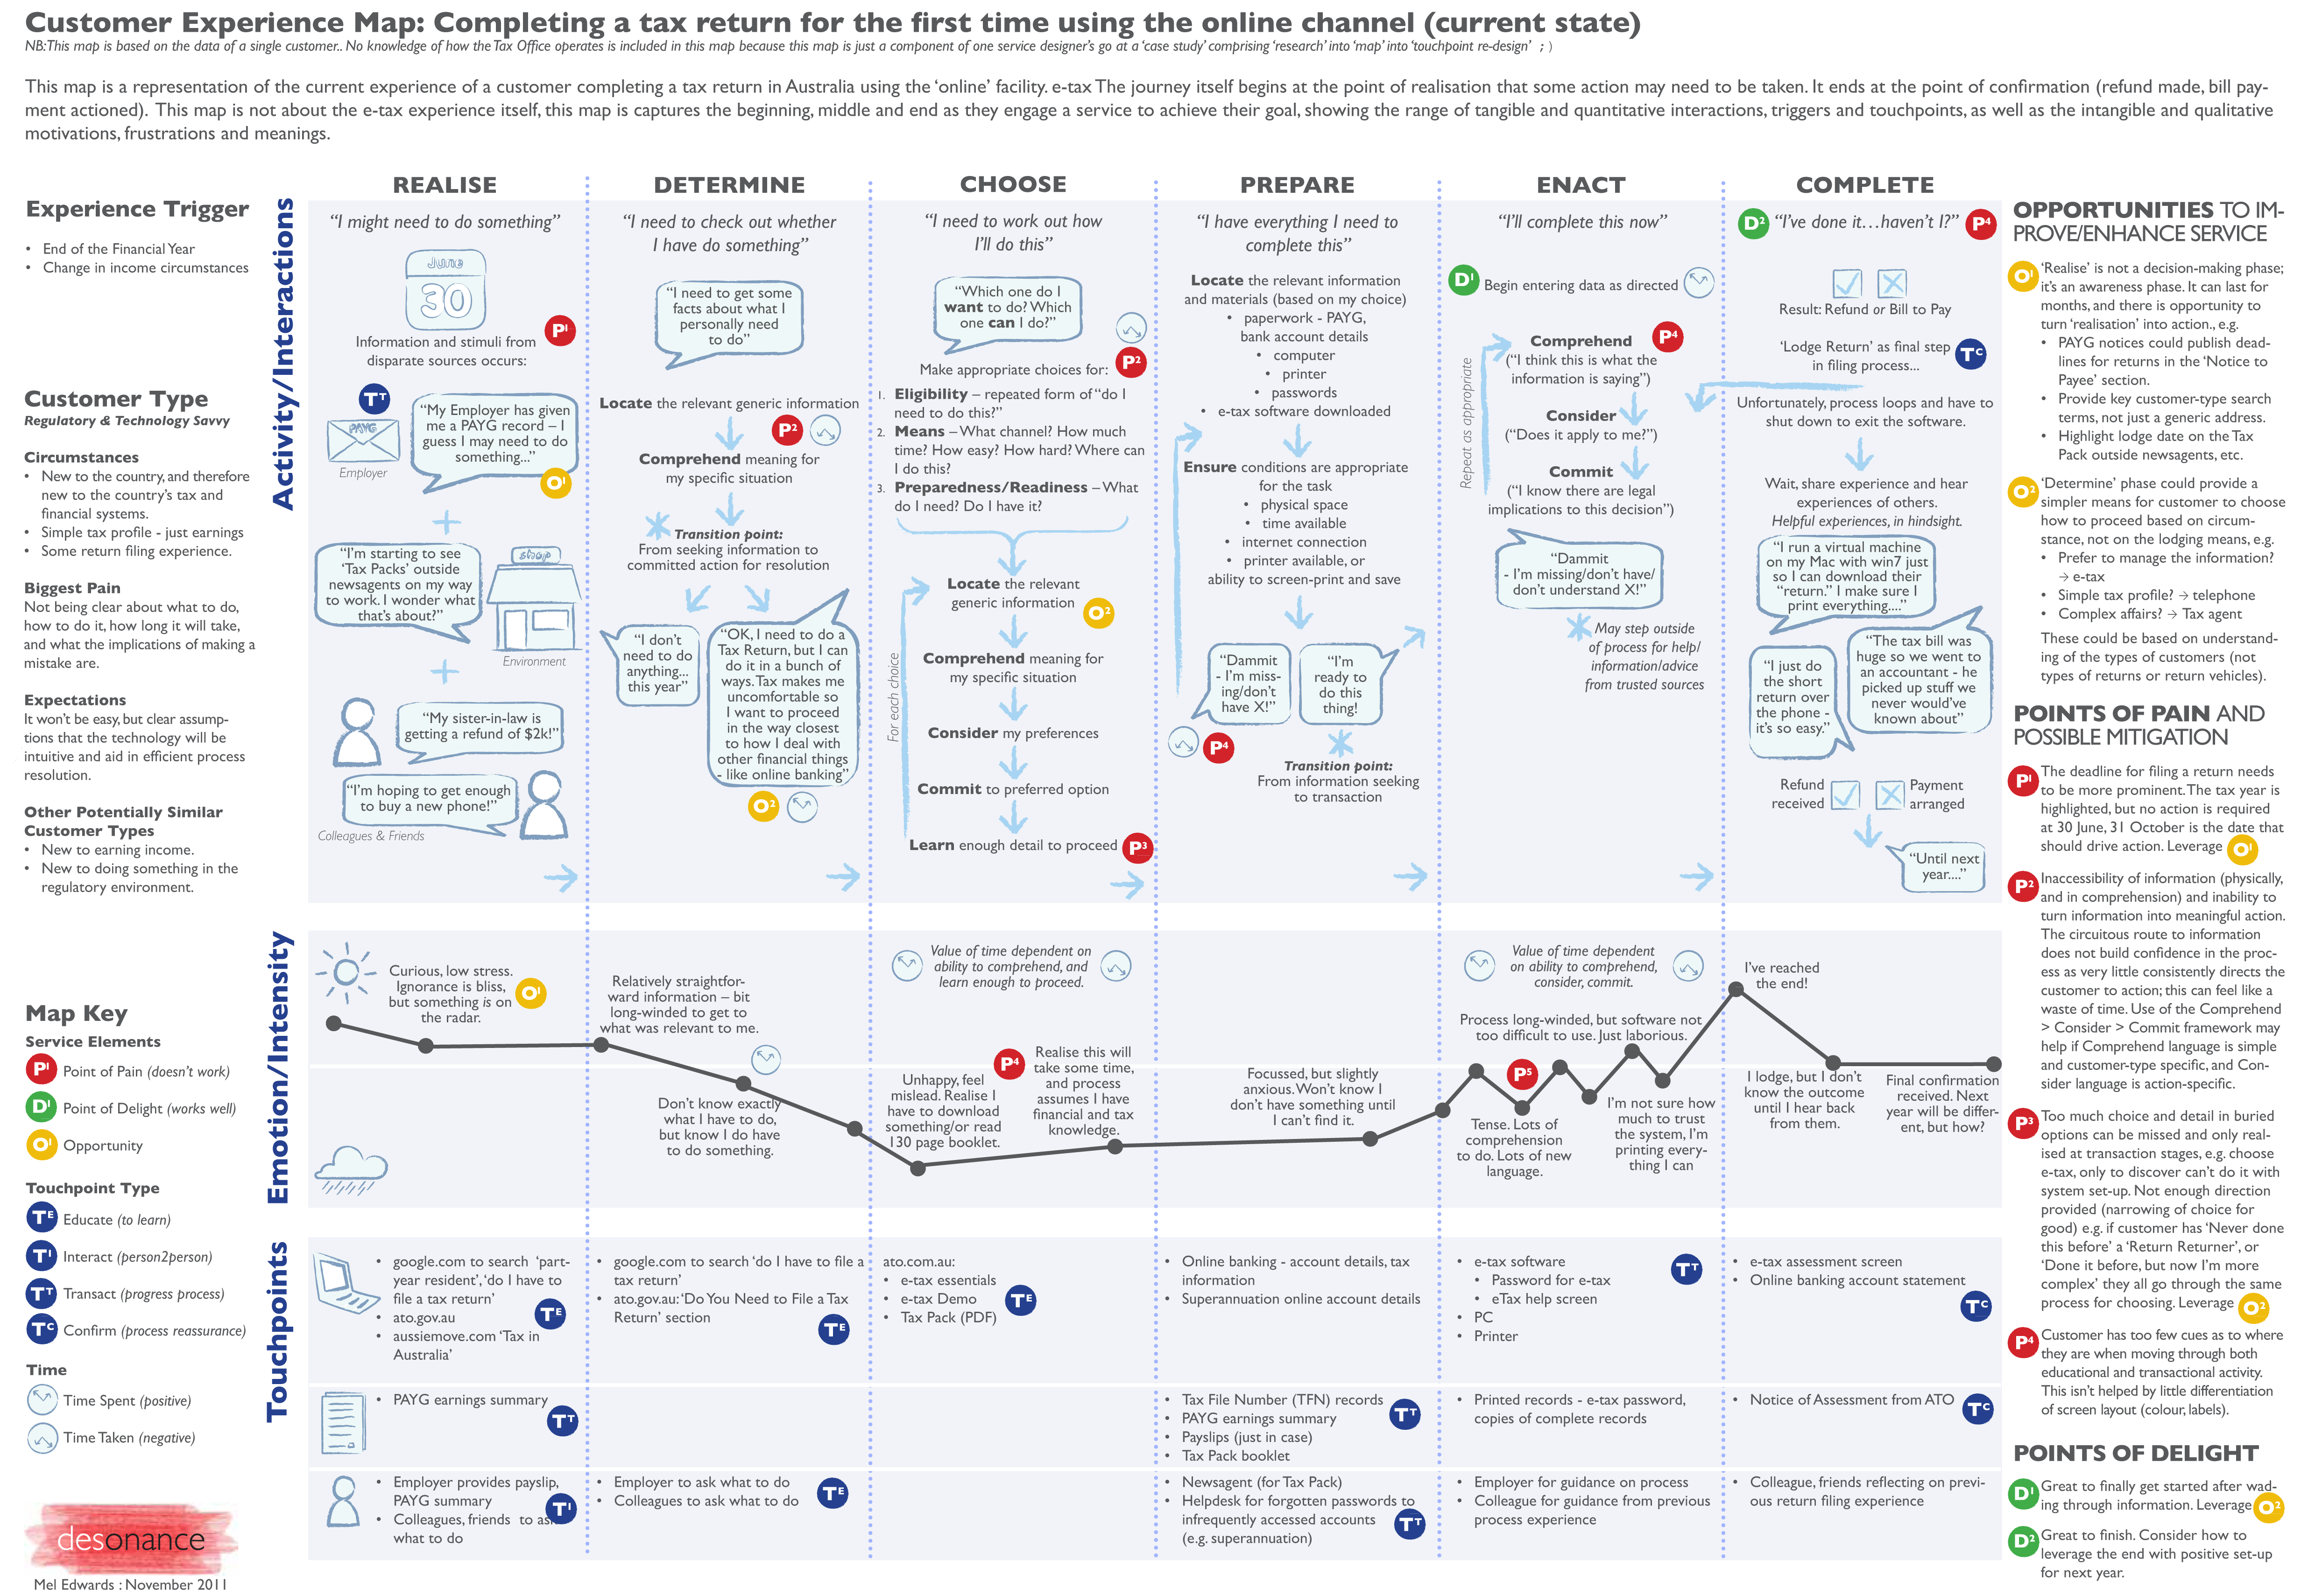
5.
Below map is an example of merging CJM and CEM. The authors have enumerated four customer groups and two situations where a given process is used. The map is comprehensive both in the graphical aspect (the use of symbols, icons, a map key, bubbles, personas) and if it comes to the content (quotes which present attitudes and emotions of customers, detailed information on possible improvements). Despite so many graphical elements used on the map it is easy to read. To prepare such map properly it is worth to have the data collected by research and analysis beforehand.
source:
https://desonance.files.wordpress.com/2011/11/return-experience-map_desonance_nov-11.pdf
6.
Another example is a simple analysis of experience of a couple planning their vacation. The map is very clear. It is a visualisation of data presenting the level of customer satisfaction and engagement where areas which need improvement were pointed out.
source:
http://www.bhavacom.com/2012/08/
7.
As you can see Customer Journey Map is a tool that can be used in many different ways to achieve different goals. For example LANCOME created a map of brand experience journey – experience their clients have with the brand. Such analysis can be helpful in creating a marketing and communications strategy.
source:
https://www.behance.net/gallery/Lancom-brand-journey/5217737
8.
Two following maps are examples of different graphical forms of presenting data at the experience map.
source:
http://www.miscmagazine.com/customer-journey-mapping/
9.
source:
http://www.lorettaneal.com/peoplesmart.html
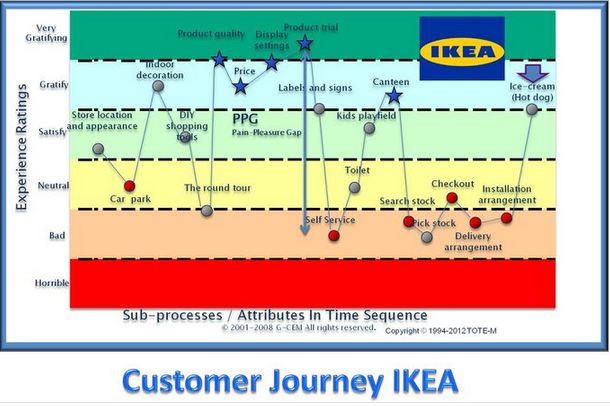
10.
And last but not least, the map created by Ikea which presents customer experience during a visit in Ikea store. You can check for yourselves if it represents your experience. What opportunities and possible improvements would you recommend for areas where customer experience was evaluated as bad? What would you change?
Summary
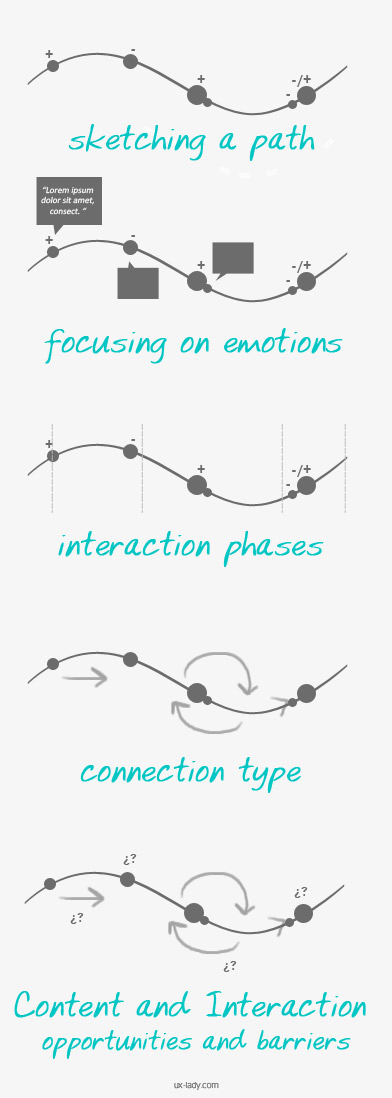
To sum up I’d like to present an infographic which shows the key elements to creating a Customer Journey Map. I encourage you to take a look at your business from the perspective of a map created in this way and share your examples.